Alwin Goh
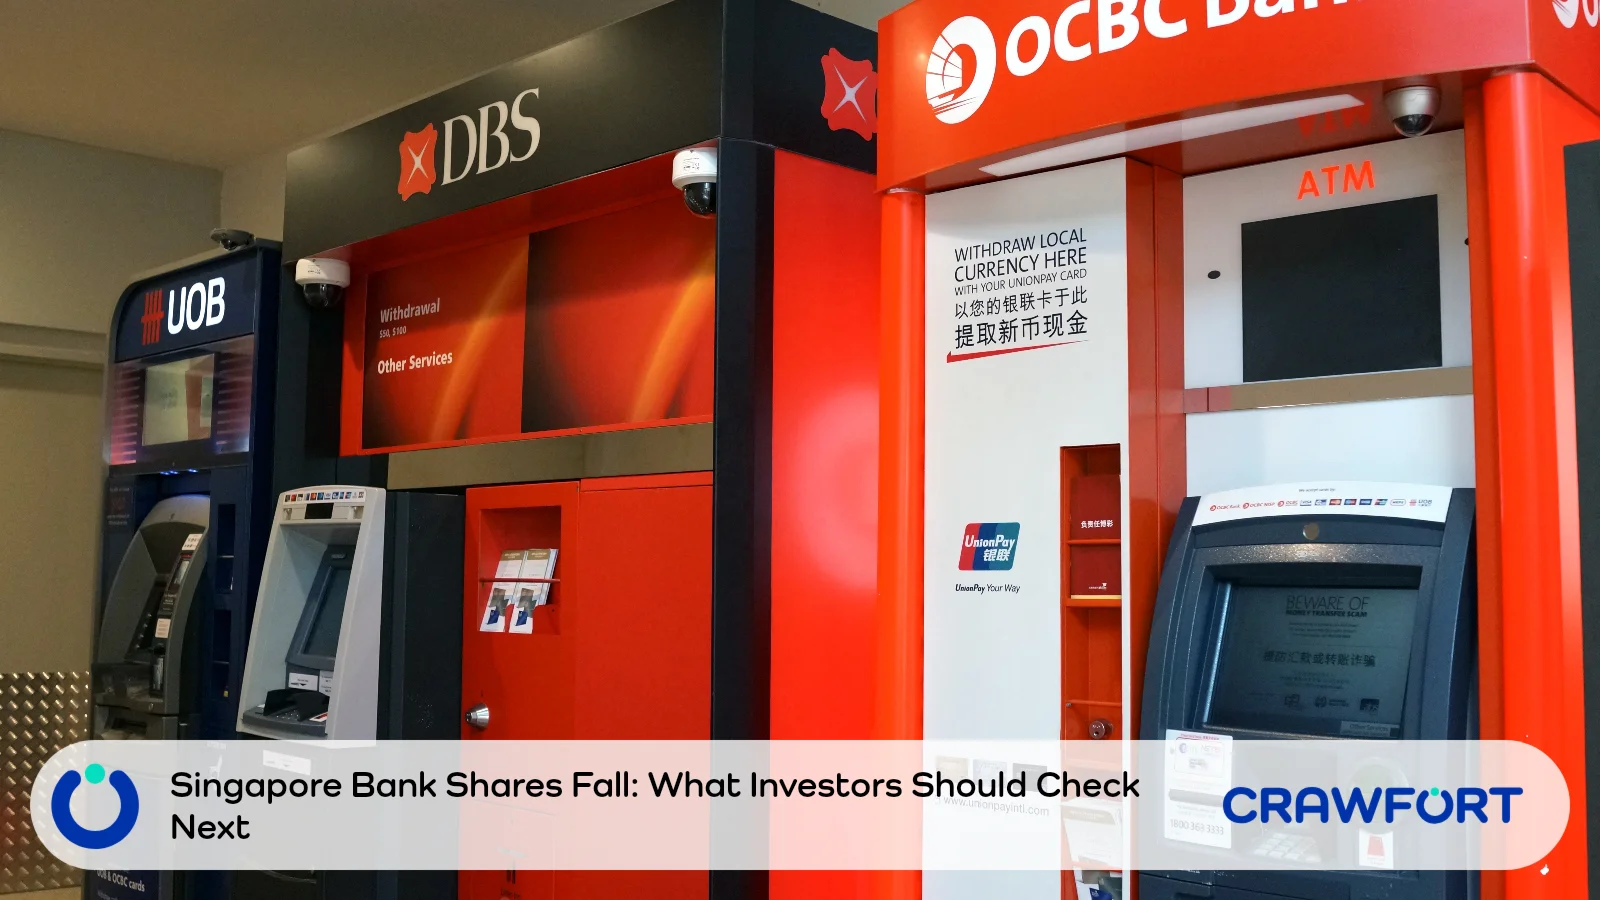
Shares of Singapore’s three local banks fell sharply for a second straight session on Thursday, 8 October 2026, dragging the Straits Times Index (STI) down 3.5% to 5,412.96. UOB led the decline with a 5.16% drop, followed by DBS at 4.70% and OCBC at 4.29%.
For investors holding DBS, UOB or OCBC, a fall of this size can create pressure to act immediately. Before buying more or selling, check whether the price drop has changed the investment case, your portfolio risk, or both.
Market reference: Prices are 8 October 2026 closing figures and may have changed since. Any 2027 earnings figures are forecasts, not results.
The Sell-Off At A Glance
The figures below show the second day’s movement only. They are daily changes on 8 October, not the combined decline across both trading sessions.
| Bank | Closing Price On 8 October 2026 | Daily Decline |
|---|---|---|
| DBS | S$73.85 | 4.70% |
| UOB | S$40.25 | 5.16% |
| OCBC | S$29.00 | 4.29% |
Even after the fall, The Business Times noted that the STI remained about 17% higher for the year, which puts the correction in the context of a strong earlier rally. Bank declines above are shown to two decimal places; some market reports round them to one.
Table of Contents
- Why Bank Shares Fell
- Check Valuation Against Sustainable Earnings
- Follow SORA Through To Loan Income
- Compare Deposit Competition And Funding Costs
- Build A 2027 Earnings Checklist
- Review Dividends And Portfolio Concentration
- Keep Shares And Deposit Protection Separate
- Write Down What Would Change Your Decision
- Frequently Asked Questions
Why Bank Shares Fell
Media reports pointed to profit taking after record highs, stretched valuations and concern over rising funding costs. A Citi downgrade of OCBC also put third quarter earnings expectations in focus. Not every broker turned cautious: RHB rated all three banks a buy in a 7 October report.
The sell-off comes against a shifting rate backdrop. On 16 September, the US Federal Reserve raised its benchmark rate by 25 basis points to 3.75% to 4.00%, its first increase in more than three years. Higher rates can lift lending income, but they can also make deposits and other funding more expensive. For bank investors, the timing of those two effects matters.
Differing broker views are useful only if you understand the assumptions behind them. A positive rating may assume faster loan repricing, stronger fee income or a higher valuation multiple. A cautious rating may reflect a demanding share price even when the bank remains highly profitable.
For an existing holding, separate two questions. Has the expected business performance weakened? Or had the share price already priced in too much improvement? Either can hurt returns, but each needs different evidence.
Avoid reading the biggest daily fall as proof that one bank has the weakest business. Price moves also reflect investor positioning and what the market had already expected.
Check Valuation Against Sustainable Earnings

A stock can be cheaper than last week and still expensive relative to its likely profits. Compare valuation measures for DBS, UOB and OCBC using the same price date and reporting period.
The price to earnings (P/E) ratio compares the share price with earnings per share. The price to book (P/B) ratio compares it with the accounting value of shareholders’ equity per share. Return on equity (ROE) measures profit against that equity.
Read the three together. A higher P/B may be justified by a strong, sustainable ROE. A low P/E looks less attractive if earnings include unusually strong trading income or one-off gains that are unlikely to recur.
Higher bond yields can also change what investors are willing to pay for dividend income. Weigh the potential return against the risk of losing capital, rather than treating a bank dividend as equivalent to bond interest.
Test The Earnings Figure Behind The Multiple
Check whether a valuation uses the last 12 months of reported earnings or an analyst’s forecast. A forward P/E based on 2027 profits carries all the uncertainty in that forecast.
For illustration, a fictional bank priced at S$30 with forecast earnings of S$3 per share has a forward P/E of 10. If the earnings estimate falls to S$2.50, the multiple rises to 12 at the same share price. These figures do not describe any of the three banks.
Keep a dated record of the forecast you use. Comparing today’s price with an old earnings estimate can give a misleading picture of value.
Follow SORA Through To Loan Income
SORA is the Singapore Overnight Rate Average. MAS explains how SORA is calculated as the volume weighted average rate of eligible unsecured overnight borrowing between banks in the Singapore dollar market. MAS publishes each day’s reading by 9am the next business day, along with one, three and six month compounded averages.
For bank investors, the key question is how a benchmark movement reaches the loan book. A loan’s interest income depends on its benchmark, contractual spread and reset schedule. Fixed rate loans may respond later than floating rate loans.
Even a sustained increase in SORA does not flow into every loan at once. The banks also lend in other currencies, so a Singapore dollar benchmark cannot explain all group earnings.
Compare Timing As Well As Direction
Look for management’s explanation of when loans reprice and how hedges affect rate sensitivity. Hedges can change how quickly market rate movements show up in reported income.
Distinguish a single day’s overnight reading from the compounded benchmark used in a loan contract. Neither is a forecast of next year’s interest rates. Use the same observation period when comparing rate trends.
Also read: How SORA home loans work, including spreads and reset dates
Compare Deposit Competition And Funding Costs

Banks pay for much of the money they lend. Savings accounts, current accounts, fixed deposits and wholesale borrowing each carry different costs and repricing schedules.
A bank’s funding bill can rise if customers shift from lower paying accounts into higher paying deposits, even without a big change in total deposits. A headline fixed deposit promotion alone cannot show the cost of a bank’s entire deposit base.
Read The Deposit Mix
Current and savings accounts are often grouped as CASA. Look at their share of total deposits alongside average funding costs, rather than assuming every CASA account is interest free.
Check whether deposits are growing because of stable customer relationships or expensive promotions. Also watch for changes in reliance on wholesale funding, including borrowing from other financial institutions and issuing debt.
The investor question is whether lending income can rise enough, and soon enough, to offset the funding bill. Net interest income is interest earned minus interest paid. Net interest margin (NIM) relates that income to average interest earning assets. As of 22 September 2026, one comparison of the three banks put NIM at 1.87% for DBS, 1.78% for UOB and 1.73% for OCBC.
A Simple Repricing Illustration
Suppose a fictional bank earns S$100 million more interest from loans during a period but pays S$120 million more on funding. With everything else unchanged, net interest income falls by S$20 million. If later loan resets bring in more income, the position could improve in a following period.
This hypothetical calculation shows how funding costs can offset extra lending income before loan resets catch up. It is not an estimate for DBS, UOB or OCBC.
Read more: Compare current fixed deposit tenures and promotion conditions. Advertised offers give customer level context; they do not measure a bank’s average funding cost.
Build A 2027 Earnings Checklist

Use the same worksheet for all three banks, then let their disclosures explain the differences. Record the figures before deciding which bank looks attractive.
The checklist below links a forecast to evidence you can revisit at each results release. Note the reporting period and separate group level measures from individual business segments.
| Area | Evidence To Record | Question For The Forecast |
|---|---|---|
| Lending And Margins | Loan growth, NIM, currency mix and repricing commentary | Does growth depend on rates, volumes or both? |
| Funding | Deposit mix, average cost and wholesale funding | How much of the lending gain reaches profit? |
| Asset Quality | Non-performing loans, allowances and credit costs | What happens if more borrowers struggle? |
| Fees | Wealth, payments and other recurring fees | Can income hold up if market activity slows? |
| Expenses | Operating costs and cost to income ratio | Is revenue growth turning into earnings? |
| Capital | Capital ratios and distribution plans | How much flexibility remains after payouts? |
Start with the banks’ own results and management commentary. For example, DBS’s quarterly financial disclosures include presentations, financial supplements and analyst call transcripts. Use the equivalent disclosures from UOB and OCBC, and align the reporting periods before comparing figures.
For each bank, note the share of Singapore dollar lending, the contribution from interest income and the sources of fee income. These differences help explain why the same SORA movement can produce different earnings outcomes. Keep definitions consistent: a group level margin should not be compared directly with a narrower commercial book margin.
Separate Loan Growth From Loan Quality
More lending can support interest income, but profit depends on pricing and repayment. Check non-performing loans together with credit costs. The first measures troubled loans; the second reflects charges for expected or realised credit losses.
A stable headline ratio deserves a closer look if exposure to stressed sectors or countries is changing. Do not assume a recent stretch of low credit costs will last indefinitely.
Check Whether Fee Income Can Repeat
Separate recurring customer fees from income that depends heavily on trading or unusually active markets. In wealth management, distinguish new customer money from increases in asset values driven by a market rally.
A rise in assets under management does not automatically produce the same percentage rise in fees. Product mix, customer activity and pricing all affect the result.
Compare Three Possible Outcomes
Write a base case, a stronger case and a weaker case in plain language. For example, the weaker case might combine slower loan growth, persistently high funding costs and rising credit losses.
Then ask which assumption matters most to the valuation. A forecast that needs several favourable developments at once leaves less room for disappointment. You do not need precise probabilities to see this.
Review Dividends And Portfolio Concentration
A lower share price raises the calculated dividend yield if the dividend stays the same. It does not guarantee the next payout will match the last one.
Separate ordinary dividends from special distributions or capital returns. Compare ordinary payouts with earnings, capital needs and each bank’s stated distribution policy. A past payment shows what happened, not what comes next.
Add Up Your Banking Exposure
Holding DBS, UOB and OCBC spreads your exposure across three companies, but all three respond to the same interest rate and economic risks. Include bank holdings inside unit trusts and ETFs when assessing concentration.
As an illustration, a S$100,000 portfolio with S$40,000 directly in bank shares and a S$20,000 fund allocation that is 50% bank stocks has S$50,000 of banking exposure. That is 50% of the portfolio, assuming no other bank holdings. The fund weighting here is hypothetical.
Check your actual fund holdings and use current portfolio values. Decide how much exposure suits your circumstances before adding shares simply because prices fell.
Keep money needed for near term bills and emergencies separate from your investment decision. Borrowing to buy shares adds fixed repayments to an uncertain return and makes it harder to ride out further falls.
Also read: The risks of using a personal loan to invest
Keep Shares And Deposit Protection Separate
Owning bank shares exposes you to changes in the market value of the business. Keeping an eligible deposit at the same bank is a different product with a different protection framework.
The SDIC Deposit Insurance Scheme FAQs confirm that eligible Singapore dollar deposits are insured up to S$100,000 in aggregate per depositor per Scheme member (as of October 2026). Shares and other investment securities are not covered.
A share price decline alone does not signal a deposit safety problem. Equally, deposit insurance does not protect shareholders against investment losses. If your concern is a deposit, check that account’s eligibility and coverage rather than drawing conclusions from the share chart.
Write Down What Would Change Your Decision
Before placing a trade, record your intended allocation, the earnings assumptions behind it and the evidence that would make you reconsider. That might be slower loan repricing, rising credit costs or a valuation that leaves too little room for weaker profits.
Review those points when third quarter results arrive. If the evidence no longer supports your assumptions, revisit the position. If key information is still missing, waiting is also a decision.